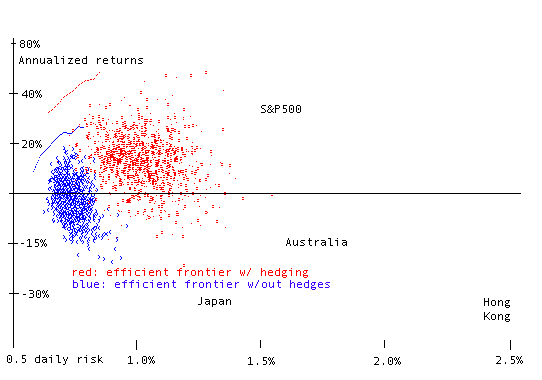
How good could a computer model of daily and weekly trading perform against doing absolutely nothing? Even though past results are not an indication of future returns, and trading of currency and index futures involves an amount of risk, The following chart summarizes the annual returns and daily risks of running several computer portfolios on available daily data.

Little BLUE ‘x’s... The computer was issued instructions on how to invest $1 million. The available opportunities were global stock index prices adjusted for currency values against the U.S. Dollar. These results are shown on the graph as little blue circles.
Little RED circles... The second set of computer instructions added long and short futures positions into the portfolio.
Instructions included a variety of choices available to the computer: holding a position for at least a week, setting a maximum 5% weight in a position, reinforcing a winning position with more weight. Weakening a position after a losing week. Allowing for a variety of probabilities (10%, 20%, 30%...) to help in decision making, and holding no more than 5% in cash, and $50 trade costs.
After 500,000 trials, there is a blue line and a red line marking the best of the best. Consider this a Capital Market Theory horizon which is limited by the portfolio rules. There are some text labels marking the performance of the separate indexes, S&P 500, Australia, Japan, Hong Kong.
| Market | Gain or Loss before 8/11/97 | Loss from 8/11 to year end |
|---|---|---|
| Australia | 1% gain | 14% loss |
| Hong Kong | 17% gain | 38% loss |
| Japan | 5% loss | 26% loss |
Take note of where the S&P 500 appears on the graph, representing a very low cost single trade held throughout the year.
Here is a quote from a business newspaper:
1997 was an interesting year full of political and financial disappointments. “The most important even in Asia was the futile attempt to use currency devaluation and inflationary monetary policy to resolve the problems created by mercantile state-planning systems in Thailand, Korea, Indonesia and Malaysia. Japan and other Asian followers chose to use mercantilistic preferences for exports, as opposed to letting market forces work to discipline private economic behavior. Without the check of the market with its price signals, economic investments were misdirected to property speculation and uneconomic endeavors characterized by rates of return lower than the cost of capital.”
Angell, Wayne, chief economist, Bear Stearns & Co., fmr Fed. Res. governor, “1997: A Year of Improbable Success,” Investor’s Business Daily, Jan 2, 1998 p.A4.